Where a Trading Strategy Diverges: Finding the First Mismatch
Final P&L can show that an outcome changed, but rarely explains why. Trace data, decisions, orders, fills and positions to the earliest mismatch.
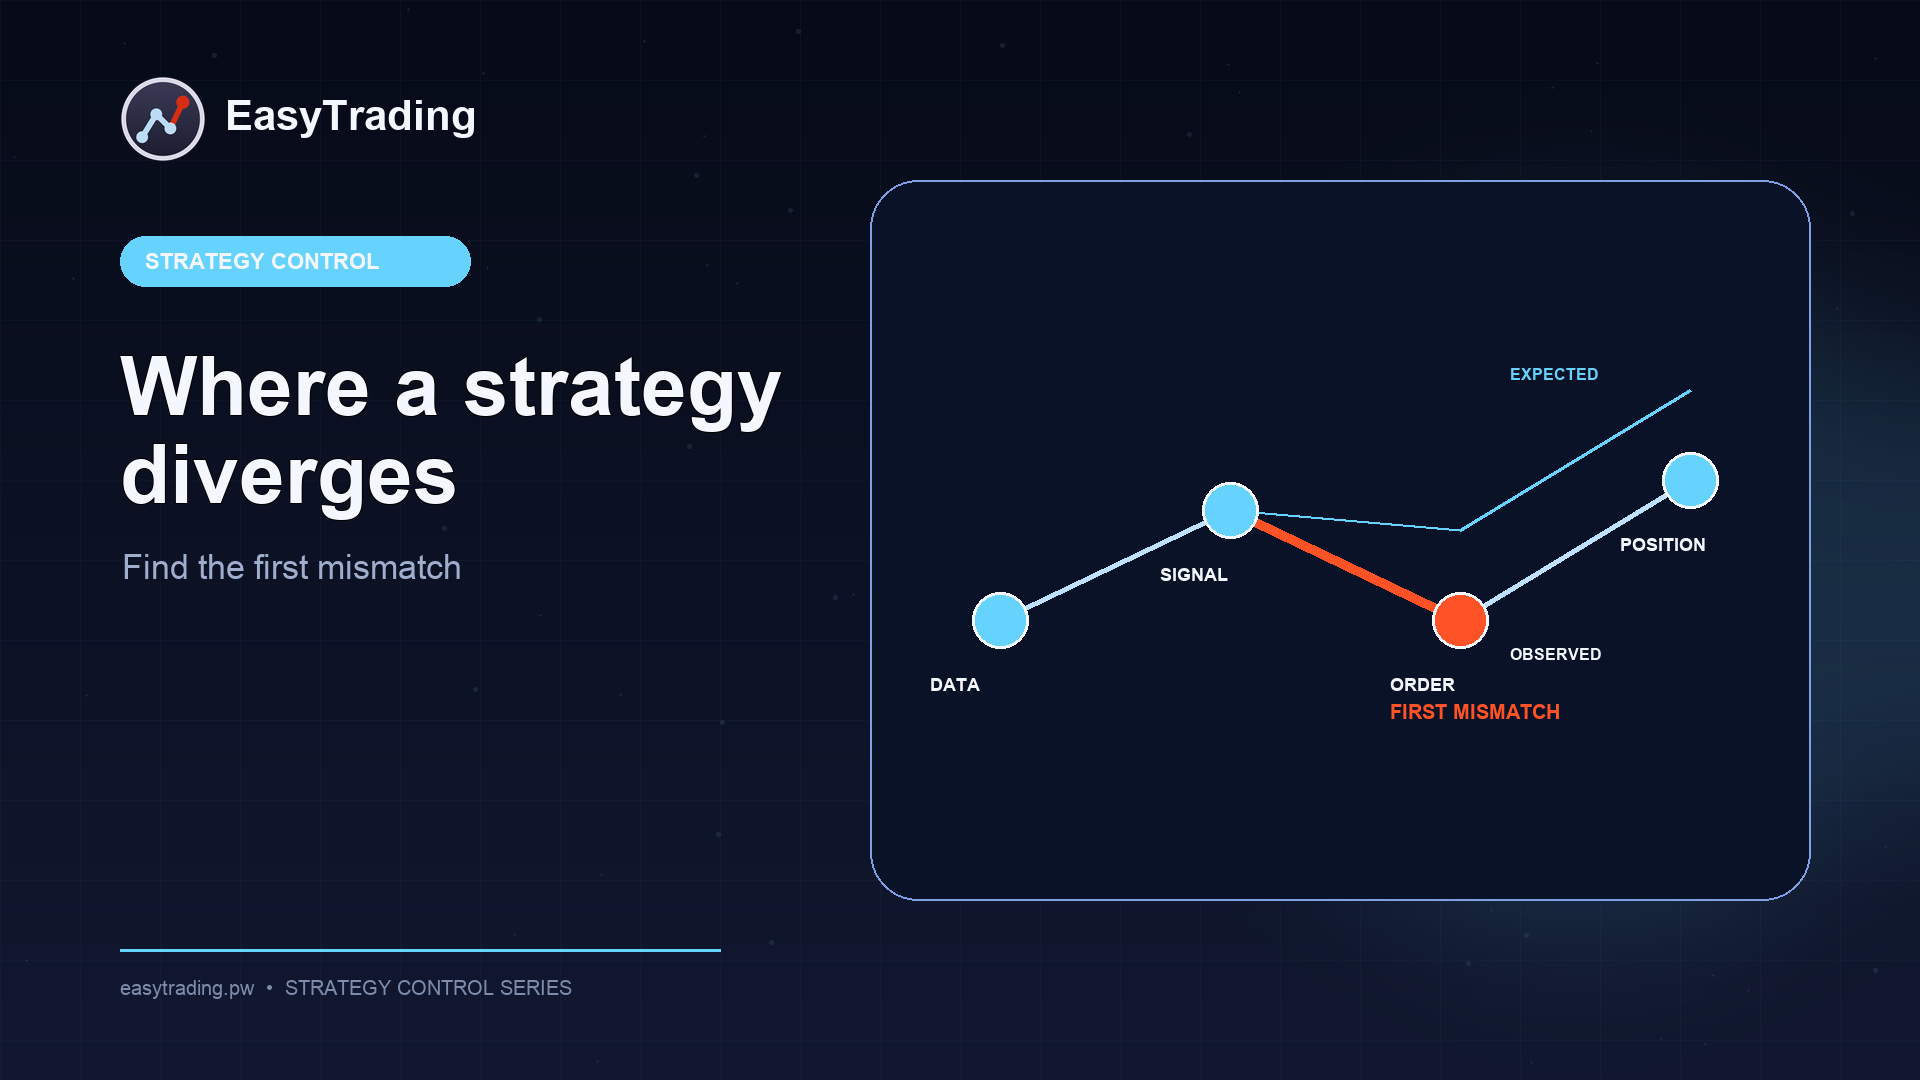
A strategy can produce one result in a backtest, another signal when the run is repeated, and a third outcome on an exchange account. The problem usually becomes visible at the end: a trade does not match, the position is wrong, or the reported performance changes. Final P&L can confirm that something diverged, but it rarely explains where.
A better investigation looks for the first mismatch: the earliest point where two versions of the same process stopped agreeing. Everything before that point is consistent. Many differences after it may be consequences rather than separate causes.
That requires a linked record of market data, strategy decisions, orders, fills and positions. A screenshot of the final equity curve is not enough.
Define the comparison before debugging
“Backtest and live trading do not match” covers several independent transitions:
- market data becomes strategy input;
- code and parameters produce a decision;
- the decision is converted into an order;
- the exchange accepts, rejects or partially fills the order;
- fills change the position;
- account history is turned into performance statistics.
Compare adjacent stages first. If the inputs differ, there is little value in starting with exchange execution. If the signals match but order quantity does not, the divergence lies between position sizing and order submission. If the submitted orders match but the fills do not, inspect the order lifecycle and the exchange record.
This method does not prove that a strategy is profitable. It identifies where the observable process changed.
Checkpoint 1: market data
The same symbol and timeframe do not guarantee the same input. A reproducible comparison should preserve:
- venue and market type;
- instrument identifier;
- period and time zone;
- candle, trade or order-book source;
- candle construction rules;
- missing records and the way gaps were handled;
- fees, funding and other modeled costs;
- the version of the downloaded dataset.
Consider a strategy that makes a decision at the close of a one-minute bar. One source assigns a trade stamped exactly 10:01:00 to the previous candle; another assigns it to the next one. Their OHLC values differ, the indicator changes, and the signal can change with it. The mismatch happened before any order was calculated.
For an incident review, preserve a small input slice around the disputed event and a checksum for the file or snapshot. Repeating the calculation on “similar” history downloaded later is not the same experiment.
Checkpoint 2: the strategy decision
If the input matches, compare the code, parameters and strategy state at decision time.
A useful record includes:
- code version;
- parameter set;
- run identifier;
- calculation timestamp;
- inputs required by the decision;
- resulting signal;
- target position or the rule used to calculate it.
Direction alone is not enough. Two runs can both say “buy” while producing different target quantities because of account balance, risk sizing, rounding or an existing position.
XTester belongs to the research and historical-testing stage. A backtest shows how fixed rules behaved on selected data under stated assumptions. It does not show that a future signal will be filled at the modeled price.
A single successful run is weak evidence of stability. Out-of-sample segments and a sequential walk-forward design can reveal whether the behavior persists on data that was not used to select parameters.
Checkpoint 3: order and fill
Once a signal becomes an order, the process is asynchronous. A successful create-order response does not necessarily mean the order has filled. It may remain open, fill in parts, complete, be canceled or be rejected later in the lifecycle.
Link the decision to exchange evidence with fields such as:
- internal decision ID;
- client order ID;
- exchange order ID;
- instrument, side, type, price and quantity;
- submission and acknowledgement times;
- cumulative filled quantity;
- average fill price;
- terminal status and rejection reason, when available.
Timeouts need special care. No response does not prove that the exchange failed to receive the request. A blind retry can create a second order. After an indeterminate result, the integration should first recover state through the client or exchange identifier, then decide whether another submission is required.
CopyTrader operates at the copying and execution stage. Its public materials already explain pre-trade settings synchronization and how displayed order-book depth affects modeled execution price. A separate post-execution task is to reconcile the intended state with the follower’s actual orders and position.
Checkpoint 4: position and statistics
A complete order list is still not the same thing as the final position. An account may also contain manual trades, other strategies, partial fills, cancellations or changes to position mode.
The operational comparison asks:
- what position the system expected;
- which orders it still considers active;
- how much has already filled;
- what position the exchange reports;
- whether any external account activity occurred.
Performance reporting begins after this operational layer. Returns, drawdown and trade distributions only make sense with a defined period, data source, fees and sample boundaries. They describe what happened on the account. They do not reconstruct the cause of an individual mismatch.
EasyTrading treats XTester, CopyTrader and TradeStat as products for different stages. Their current public surfaces should not be described as one fully connected automated system. The shared principle is already useful: every stage should preserve its own evidence and a stable link to the previous one.
A practical incident-review sequence
- Fix the disputed instrument and a narrow time window.
- Preserve inputs and settings without overwriting the original records.
- Link the run, signal, client order and exchange order identifiers.
- Compare stages in order: data → decision → order → fills → position.
- Mark the first difference rather than every downstream symptom.
- Classify the cause: data, strategy logic, sizing, transport, exchange state, manual intervention or statistics.
- After a fix, repeat the same scenario on the preserved input and test nearby cases.
A short incident report should state what was expected, what was observed, where the first difference appeared, which records prove it, and what rule now prevents a repeat. That is more useful than a broad conclusion that “trades sometimes differ.”
What an evidence chain provides
A linked history does not remove market risk, and it does not turn a backtest into a forecast. It provides a smaller but verifiable result: a reviewer can trace how specific data produced a decision, what was submitted to the exchange, and how the account position changed.
Without that connection, the final number has no clear provenance. With it, a dispute can be investigated from the first mismatch without confusing strategy quality, infrastructure behavior and market behavior.
This article is for educational purposes and is not investment advice. Historical tests and technical reconciliation do not guarantee future returns or identical execution.